Refit an sdmTMB index under alternative data filters
Source:R/data-scenarios.R
sdmTMB_data_scenarios.RdRefits a fitted sdmTMB::sdmTMB() model once per scenario, each scenario
being a rule that drops or modifies data rows (e.g. drop tows shorter than
a limit, cap densities at a quantile, drop a cruise series) or a different
prediction grid (e.g. restrict the index to an area sampled every year). All
refits reuse the model's mesh and every setting of its original call, so
only the data or the grid change, and the full model's estimates are used
as starting values.
The function is meant for deciding how to handle an anomalous index value:
test general rules first, and compare them with a named exclusion of the
cruise or survey behind the anomaly. A general rule that removes the
anomaly without distorting other years is preferable; an exclusion is
defensible when no general rule does, and the scenario table documents why.
Haul-level rules (trimming or capping densities, minimum tow length) cannot
remove an anomaly that builds up over many moderate hauls of one cruise; use
sdmTMB_leave_out() to see whether an anomaly is driven by single hauls or
by whole cruises.
Usage
sdmTMB_data_scenarios(
  object,
  scenarios,
  newdata,
  area = 1,
  baseline = "Baseline",
  index = c("plugin", "split"),
  nsplit = NULL,
  bias_correct = FALSE,
  level = 0.95,
  warm_start = TRUE,
  n_workers = 1,
  future_seed = TRUE,
  verbose = TRUE
)
Arguments
- object
A fitted
sdmTMB::sdmTMB()model.- scenarios
A named list of scenarios. Each element is either
a function of the model data returning a logical vector,
TRUEfor the rows to keep (e.g.function(d) d$tow_length >= 0.75);a function returning a data frame with the same rows as the model data and modified values (e.g. densities capped at a quantile); or
a list with optional elements
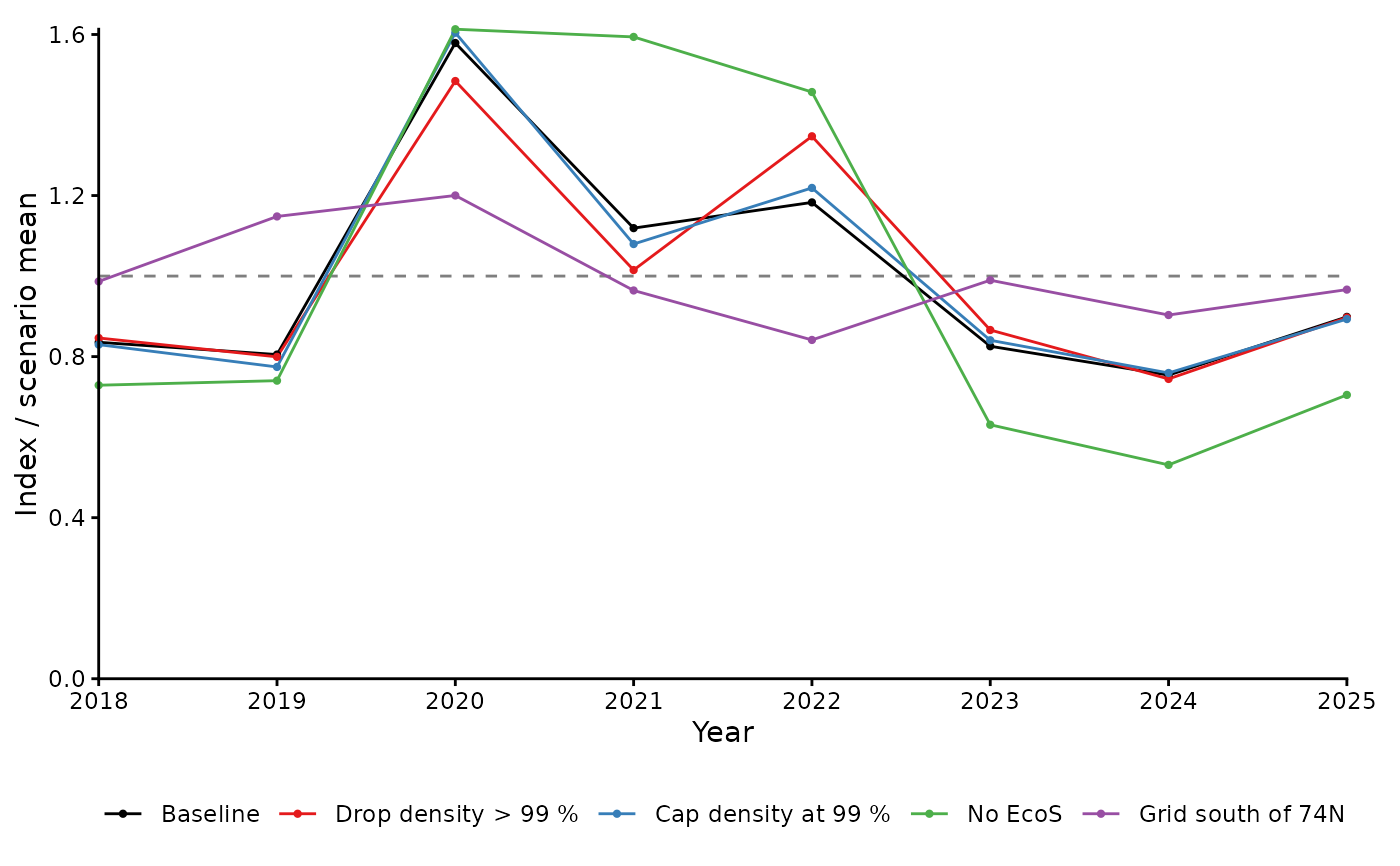
data(one of the two functions above) andnewdata(a prediction grid used for that scenario instead ofnewdata; its index is not on the same domain as the others, so compare it withplot(x, type = "scaled")orpeak_ratio()).
A model fitted with a numeric
offsetvector keeps the original offset of each kept row, so a scenario that changes effort (e.g. swept area) only changes the offset when the model's offset was given as a column name.- newdata
Prediction grid with the predictors of the fitted model and its time column.
- area
Grid cell area: a single value, a column name in the grids, or a numeric vector with one value per row of
newdata(only for scenarios that usenewdata).- baseline
Character. Name of the reference scenario: a refit to all data on
newdata. Default"Baseline".- index
Character.
"plugin"(default) or"split"(seesdmTMB_leave_out()).- nsplit, bias_correct, level
Passed to
sdmTMB::get_index_split()whenindex = "split".- warm_start
Logical. Use the full model's estimates as starting values? Default
TRUE.- n_workers
Integer. Number of parallel workers. Default
1, which uses whateverfuture::plan()is currently set. Values> 1set a temporary parallel plan (forkedfuture::multicorewhere supported, otherwisefuture::multisession).- future_seed
Logical or integer. Future-compatible random seed.
- verbose
Logical. Show progress messages? Default
TRUE.
Value
An object of class sdmTMB_data_scenarios, a list with
index: the index of each scenario by year, with columnsscenario,year,est(andlwr,upr,seforindex = "split"),ratio(estdivided by the baseline) andremoved(TRUEfor years without data in the scenario, whereestisNA);summary: one row per scenario withn_rows(rows kept),n_modified(rows whose values changed),grid("own"when the scenario has its own grid),mean_abs_change(mean absolute relative change from the baseline over the years) andall_ok(whether the refit passedsdmTMB::sanity()).
Examples
# \donttest{
data(sebastes)
sub <- subset(sebastes, cruiseseries %in% c("EcoS", "WinterS") & year >= 2018)
mesh <- sdmTMB::make_mesh(sub, c("X", "Y"), cutoff = 60)
fit <- sdmTMB::sdmTMB(
biomass ~ 1, data = sub, time = "year", mesh = mesh,
family = sdmTMB::tweedie(), spatiotemporal = "ar1",
offset = log(sub$swept_area)
)
region <- make_survey_prediction_region(sub, crs = 32633)
grid <- sdmTMB::replicate_df(
make_prediction_grid(region, resolution = 30), "year", unique(sub$year)
)
cap <- function(d) {
lim <- stats::quantile(d$density, 0.99)
d$biomass <- pmin(d$biomass, lim * d$swept_area)
d
}
sc <- sdmTMB_data_scenarios(
fit,
scenarios = list(
"Drop density > 99 %" = function(d) d$density <= stats::quantile(d$density, 0.99),
"Cap density at 99 %" = cap,
"No EcoS" = function(d) d$cruiseseries != "EcoS",
"Grid south of 74N" = list(newdata = grid[grid$Y < 8200, ])
),
newdata = grid, area = (30 / 1.852)^2
)
#> ⠙ Refitting the baseline
#> ✔ Refitting the baseline [6ms]
#>
#> ⠙ Refitting 4 scenarios
#> ✔ Refitting 4 scenarios [4ms]
#>
sc$summary
#> # A tibble: 5 × 6
#> scenario n_rows n_modified grid mean_abs_change all_ok
#> <fct> <int> <int> <chr> <dbl> <lgl>
#> 1 Baseline 4056 0 main 0 TRUE
#> 2 Drop density > 99 % 4015 0 main 0.102 TRUE
#> 3 Cap density at 99 % 4056 41 main 0.0197 TRUE
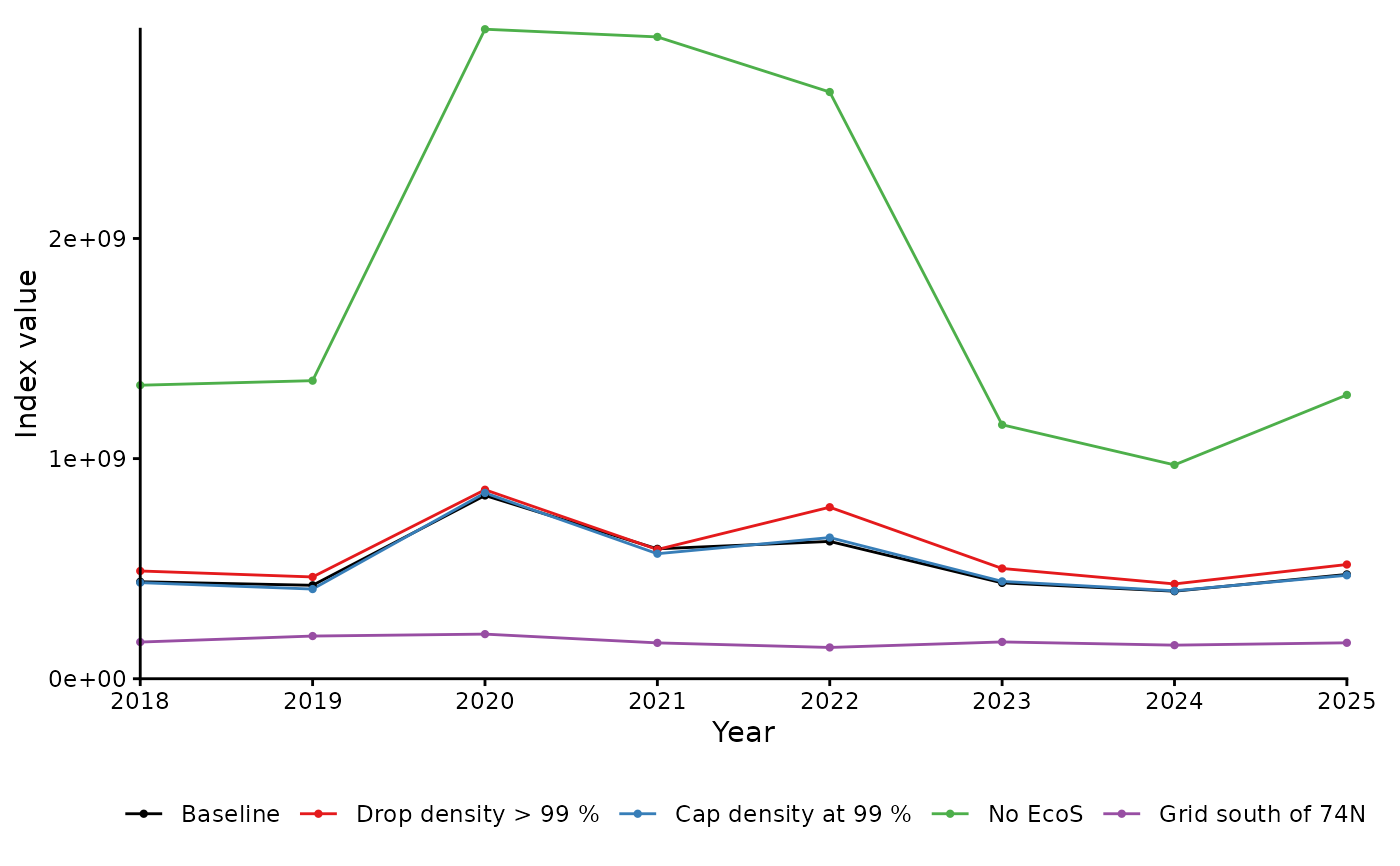
#> 4 No EcoS 2677 0 main 2.35 TRUE
#> 5 Grid south of 74N 4056 0 own 0.663 TRUE
peak_ratio(sc, year = 2020)
#> # A tibble: 5 × 4
#> scenario peak neighbours peak_ratio
#> <fct> <dbl> <dbl> <dbl>
#> 1 Baseline 832494220. 507279459. 1.64
#> 2 Drop density > 99 % 858550320. 524704767. 1.64
#> 3 Cap density at 99 % 843973841. 487634508. 1.73
#> 4 No EcoS 2950677485. 2134902773. 1.38
#> 5 Grid south of 74N 202656735. 178340215. 1.14
plot(sc)
 plot(sc, type = "scaled")
 # }