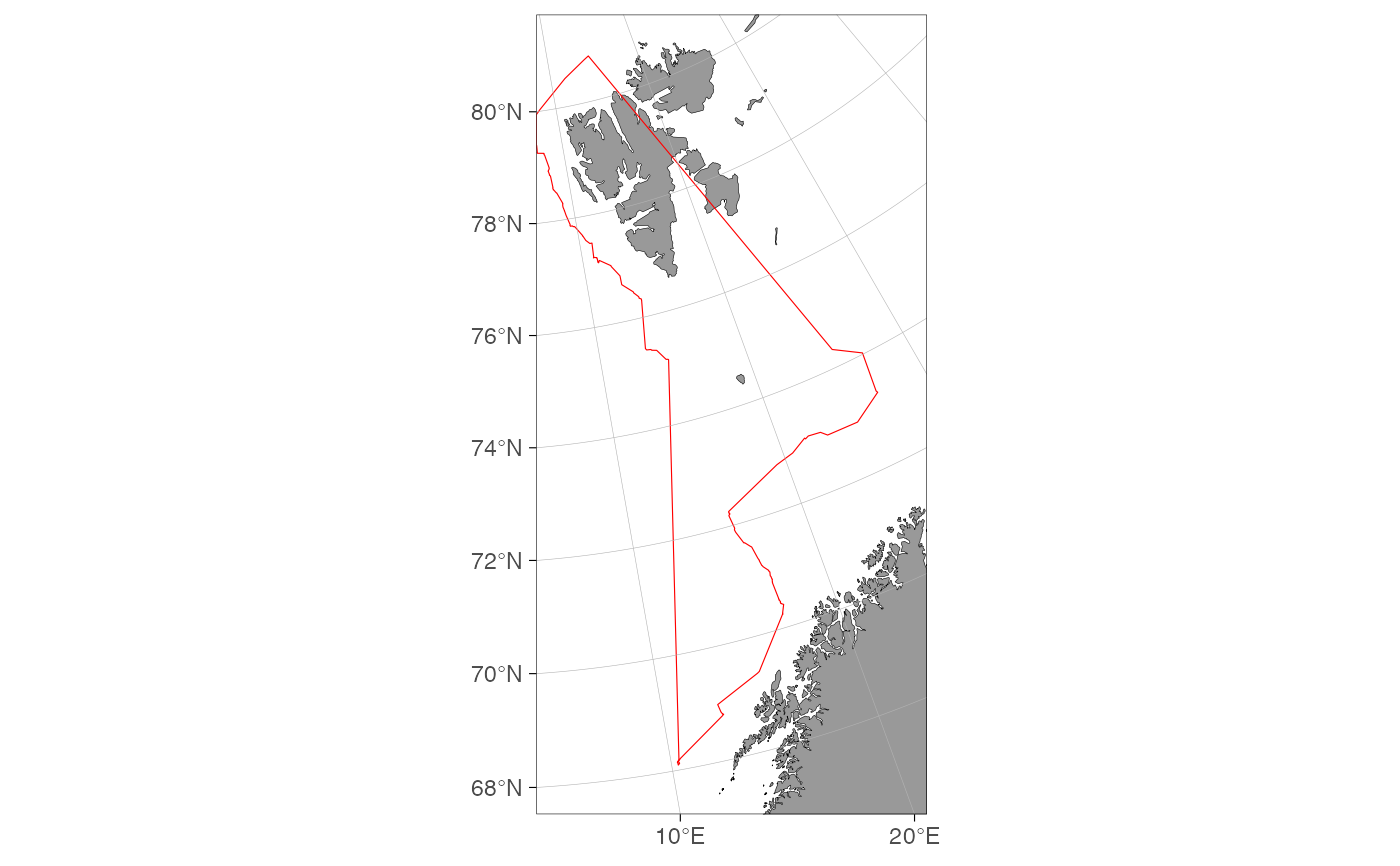
Build a concave-hull prediction region from survey positions
Source:R/prediction-grid.R
make_survey_prediction_region.RdCreates an sf polygon describing the spatial footprint of a set of sampling
positions, using a concave hull (concaveman::concaveman()). This is used to
restrict a prediction grid to the area a survey actually covers, rather than
the full model domain.
Usage
make_survey_prediction_region(
  data,
  crs,
  xy_cols = c("X", "Y"),
  coord_multiplier = 1000,
  concavity = 5,
  buffer = 1
)
Arguments
- data
A data frame with coordinate columns (see
xy_cols) in the same units as the model (typically km).- crs
Coordinate reference system of the projected coordinates.
- xy_cols
Character vector of length two naming the coordinate columns. Default
c("X", "Y").- coord_multiplier
Numeric factor to convert
xy_colsto the CRS units (e.g.1000to convert km to m). Default1000.- concavity
Numeric. Concavity parameter passed to
concaveman::concaveman(). Larger values give looser (more convex) hulls. Default5.- buffer
Numeric. Buffer (in CRS units) applied to the hull to avoid clipping the outermost stations. Default
1.