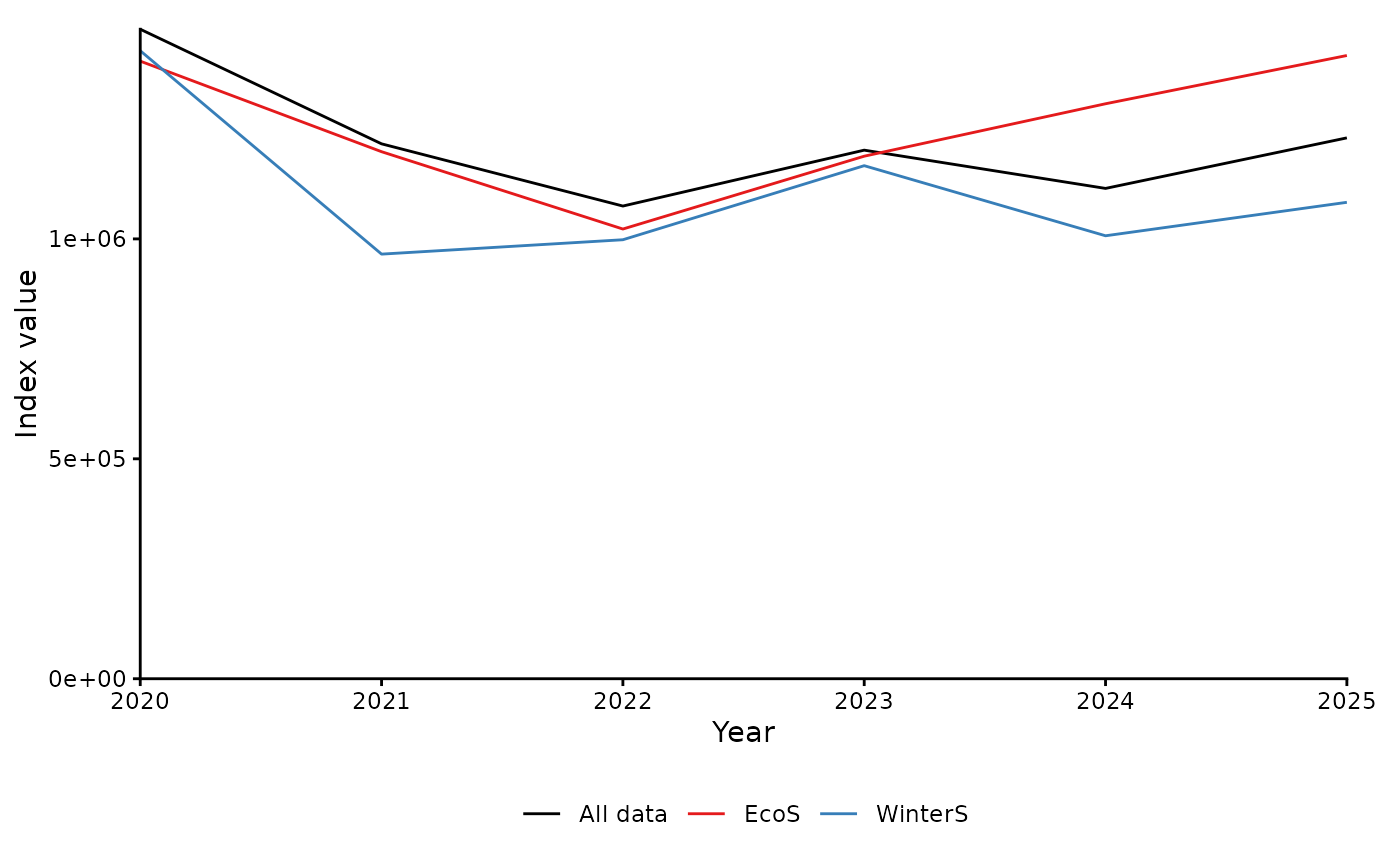
Plots the results of sdmTMB_leave_out(): the full index together with the
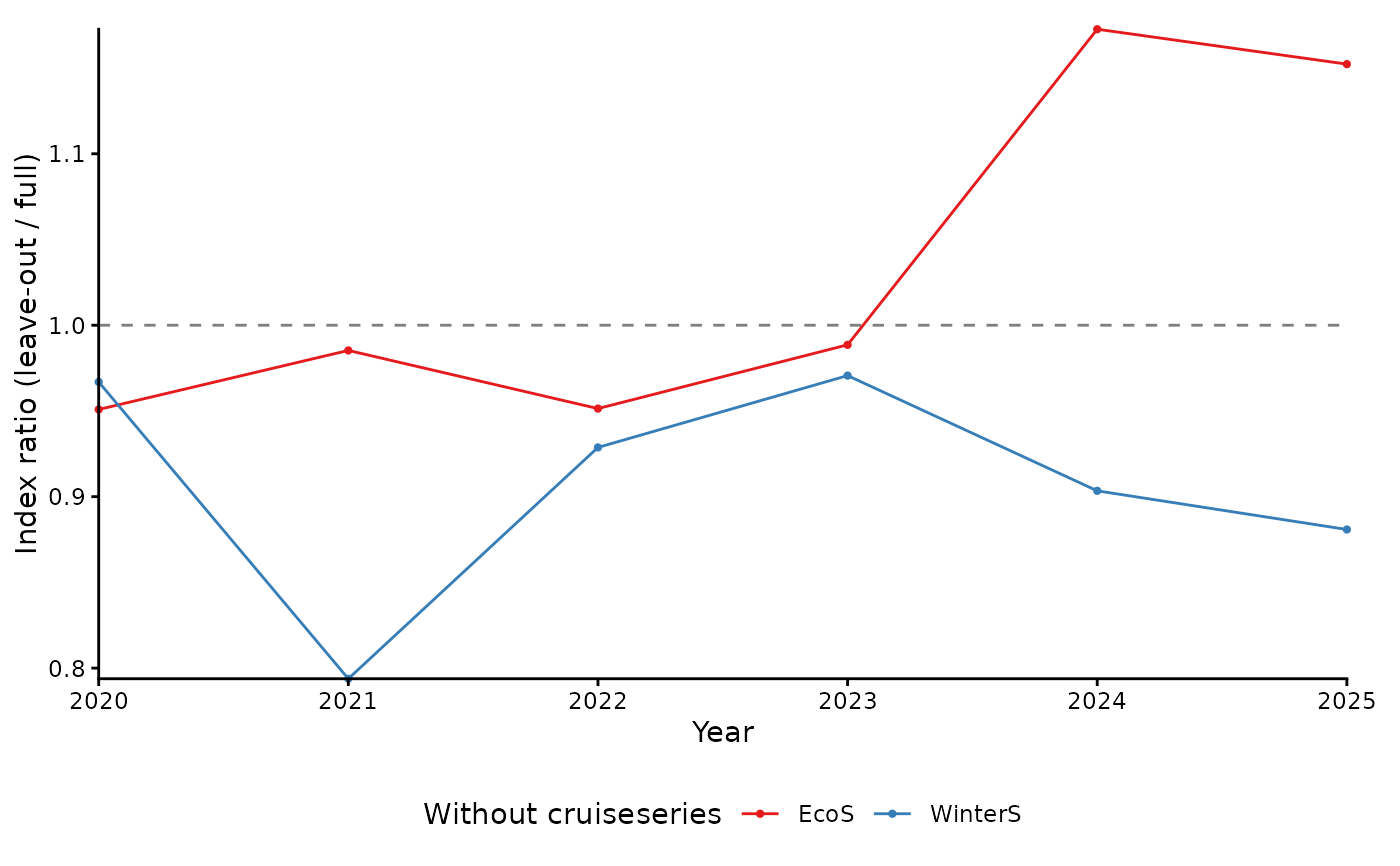
index from each leave-out refit (type = "index"), the ratio of each
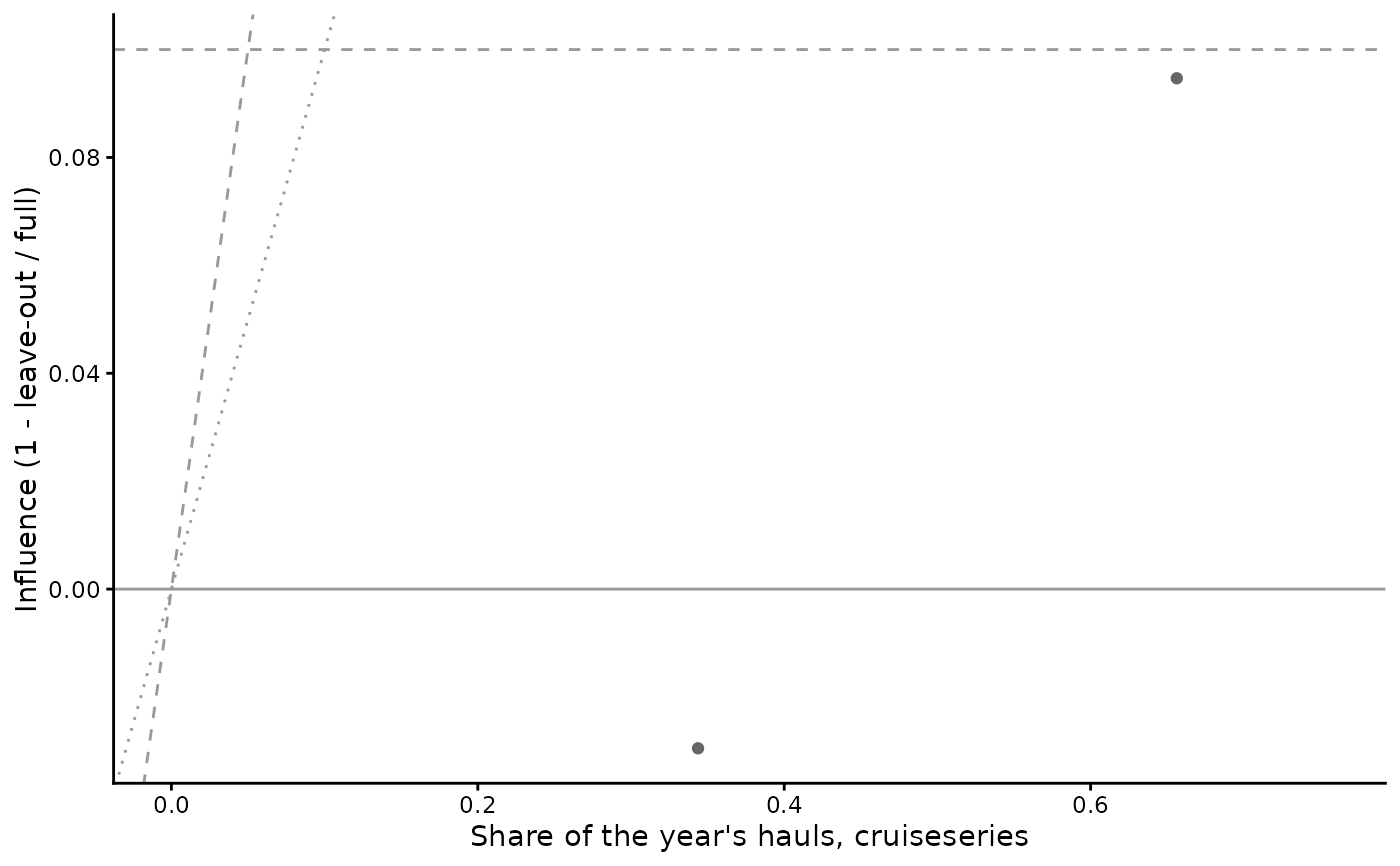
leave-out index to the full index (type = "ratio"), or influence against
haul share (type = "leverage"), where identifiers above the
leverage_limit line and the influence_limit line are labelled. Years
without data after removing an identifier are gaps.
Usage
# S3 method for class 'sdmTMB_leave_out'
plot(
  x,
  type = "index",
  ids = NULL,
  index_divisor = NULL,
  unit = NA,
  base_size = 11,
  influence_limit = 0.1,
  leverage_limit = 2,
  ...
)
Arguments
- x
An object of class
sdmTMB_leave_out.- type
Character.
"index"(default),"ratio"or"leverage".- ids
Optional subset of identifiers to plot. Defaults to all; for many identifiers (e.g. hauls), pass the most influential ones.
- index_divisor
Optional numeric divisor applied to index values.
- unit
Character. Unit label for the index axis. Default
NA.- base_size
Numeric. Base font size. Default
11.- influence_limit, leverage_limit
Numeric. Flag limits for
type = "leverage". Defaults0.1and2.- ...
Currently ignored.
Examples
# \donttest{
data(sebastes)
sub <- subset(sebastes, cruiseseries %in% c("EcoS", "WinterS") & year >= 2020)
mesh <- sdmTMB::make_mesh(sub, c("X", "Y"), cutoff = 60)
fit <- sdmTMB::sdmTMB(
biomass ~ 1, data = sub, time = "year", mesh = mesh,
family = sdmTMB::tweedie(), spatiotemporal = "iid",
offset = log(sub$swept_area)
)
region <- make_survey_prediction_region(sub, crs = 32633)
grid <- sdmTMB::replicate_df(
make_prediction_grid(region, resolution = 30), "year", unique(sub$year)
)
lo <- sdmTMB_leave_out(fit, id_col = "cruiseseries", newdata = grid)
#> ⠙ Refitting the full model
#> ✔ Refitting the full model [4ms]
#>
#> ⠙ Refitting without each of 2 identifiers
#> ✔ Refitting without each of 2 identifiers [3ms]
#>
plot(lo)
 plot(lo, type = "ratio")
 plot(lo, type = "leverage")
 # }