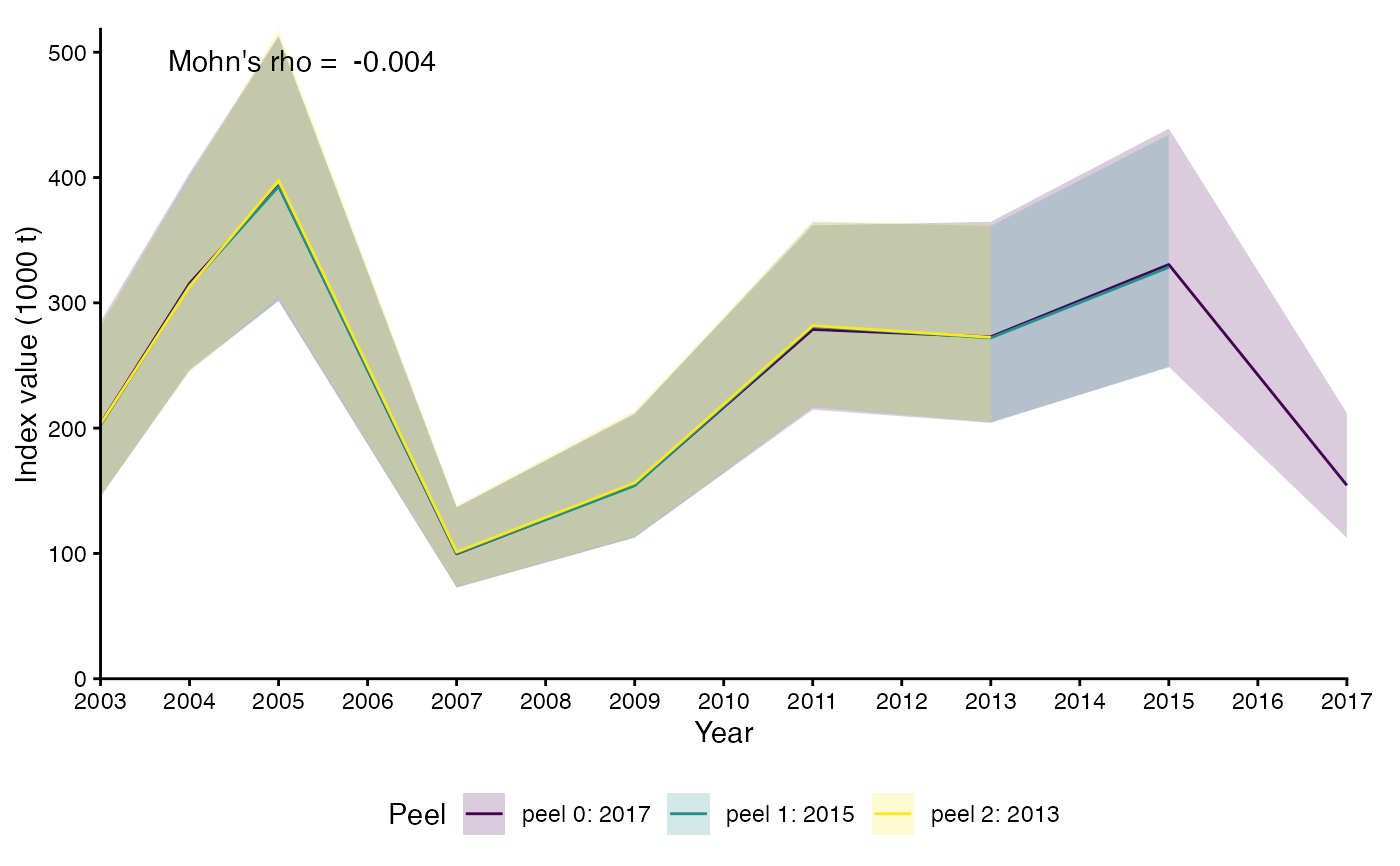
Creates a layered ggplot of retrospective (peeled) indices produced by
sdmTMB_retro(), with confidence ribbons for each peel and Mohn's rho
(computed with mohns_rho()) annotated on the plot.
Usage
# S3 method for class 'sdmTMB_retro'
plot(x, index_divisor = NULL, index_unit = NA, base_size = 11, ...)
Arguments
- x
An object of class
sdmTMB_retro(the output ofsdmTMB_retro()).- index_divisor
Optional numeric. Index values are divided by this before plotting (useful to rescale units). Default
NULL.- index_unit
Optional character shown in the y-axis label. If
NA(default) the axis label is"Index value".- base_size
Base font size for the ggplot theme. Default
11.- ...
Currently ignored.
Examples
# \donttest{
mesh <- sdmTMB::make_mesh(sdmTMB::pcod, c("X", "Y"), cutoff = 25)
m <- sdmTMB::sdmTMB(
data = sdmTMB::pcod,
formula = density ~ 0 + as.factor(year),
time = "year", mesh = mesh, family = sdmTMB::tweedie(link = "log")
)
nd <- sdmTMB::replicate_df(sdmTMB::qcs_grid, "year", unique(sdmTMB::pcod$year))
retr <- sdmTMB_retro(m, nd, nyears = 3, n_workers = 1)
plot(retr, index_divisor = 1e3, index_unit = "1000 t")
 # }
# }