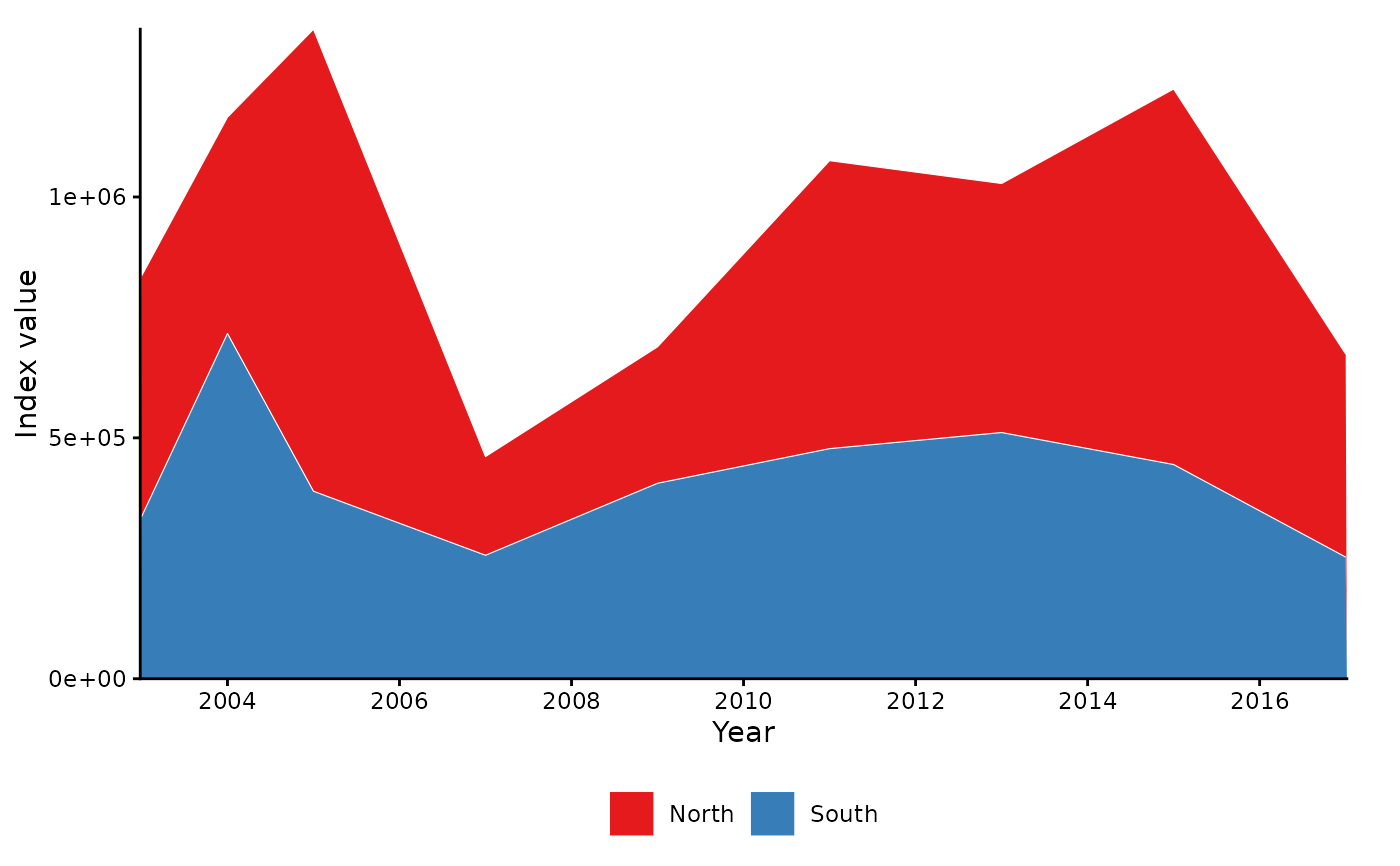
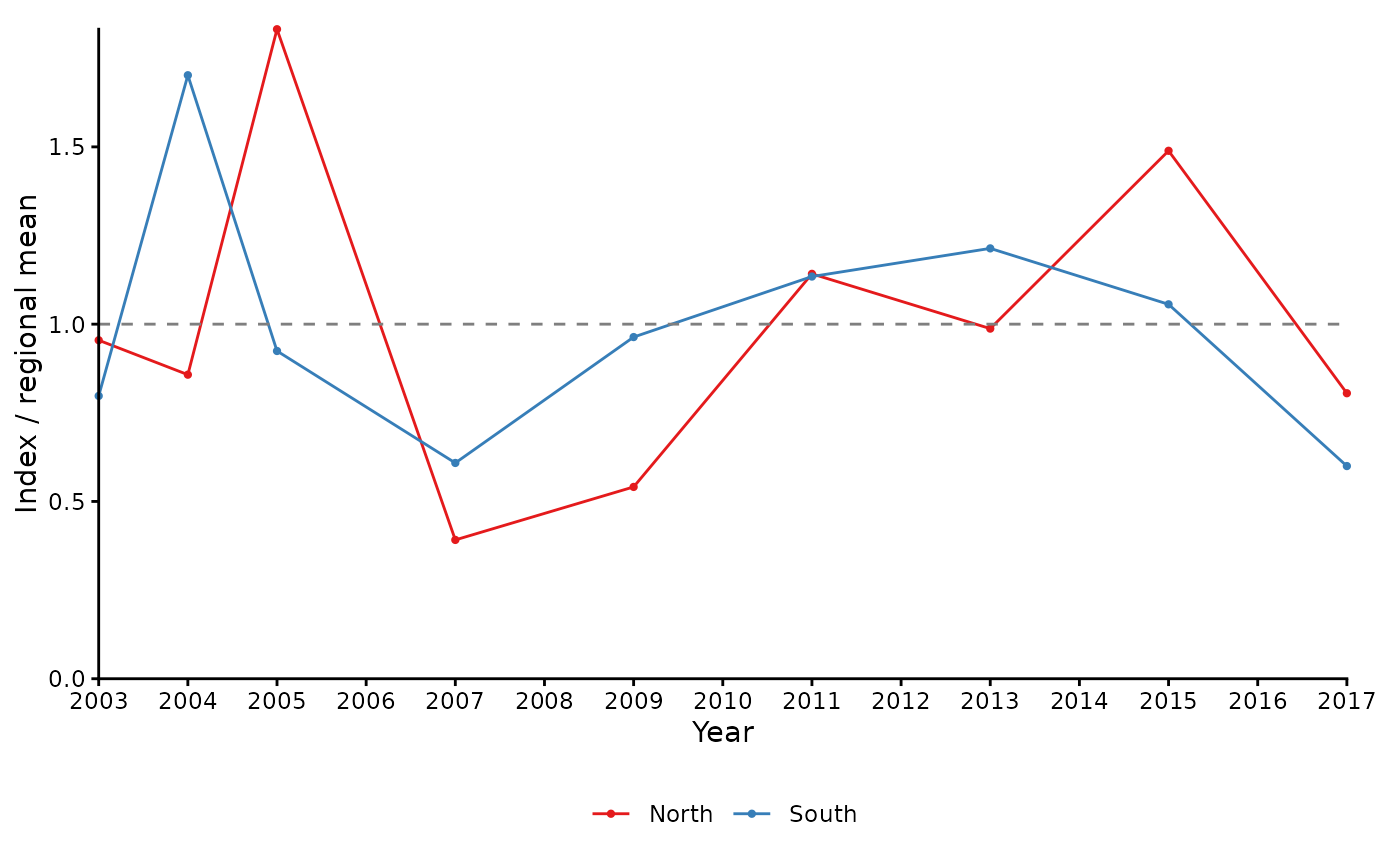
Sums the response-scale predictions of a fitted model over a prediction grid by year and by a region column of the grid. The result shows which part of the domain drives an index value: a peak carried by one region, sampled unusually in that year, points to a coverage artefact rather than a stock change. Regions can be anything in the grid: subareas, depth bands, inside and outside a survey footprint.
The index is the plug-in sum of predictions times area, without standard
errors. Its total over regions equals the plug-in index of the whole grid.
Usage
index_by_region(
  object,
  newdata = NULL,
  region_col,
  area = 1,
  time_col = NULL,
  ref_years = NULL
)
Arguments
- object
A fitted
sdmTMB::sdmTMB()model, or a data frame of predictions on the response scale (predict(fit, newdata, type = "response")) that containsest, the time column andregion_col.- newdata
Prediction grid with
region_col. Not used whenobjectis a data frame of predictions.- region_col
Name of the region column in
newdata.- area
Grid cell area: a single value, a column name, or a numeric vector with one value per grid row. Default
1.- time_col
Name of the time column. Defaults to
object$timefor a model and"year"otherwise.- ref_years
Optional years over which each region's mean is taken for
rel_mean. Default all years.
Value
An object of class sdmTMB_region_index: a tibble with year,
region, est (the region's index), share (its share of the year's
total) and rel_mean (est divided by the region's mean over
ref_years).
Examples
# \donttest{
mesh <- sdmTMB::make_mesh(sdmTMB::pcod, c("X", "Y"), cutoff = 20)
fit <- sdmTMB::sdmTMB(density ~ 1, data = sdmTMB::pcod, time = "year",
mesh = mesh, family = sdmTMB::tweedie(), spatiotemporal = "iid")
grid <- sdmTMB::replicate_df(sdmTMB::qcs_grid, "year", unique(sdmTMB::pcod$year))
grid$region <- ifelse(grid$Y > 5750, "North", "South")
ri <- index_by_region(fit, grid, region_col = "region", area = 4)
plot(ri)
 plot(ri, type = "relative")
 # }