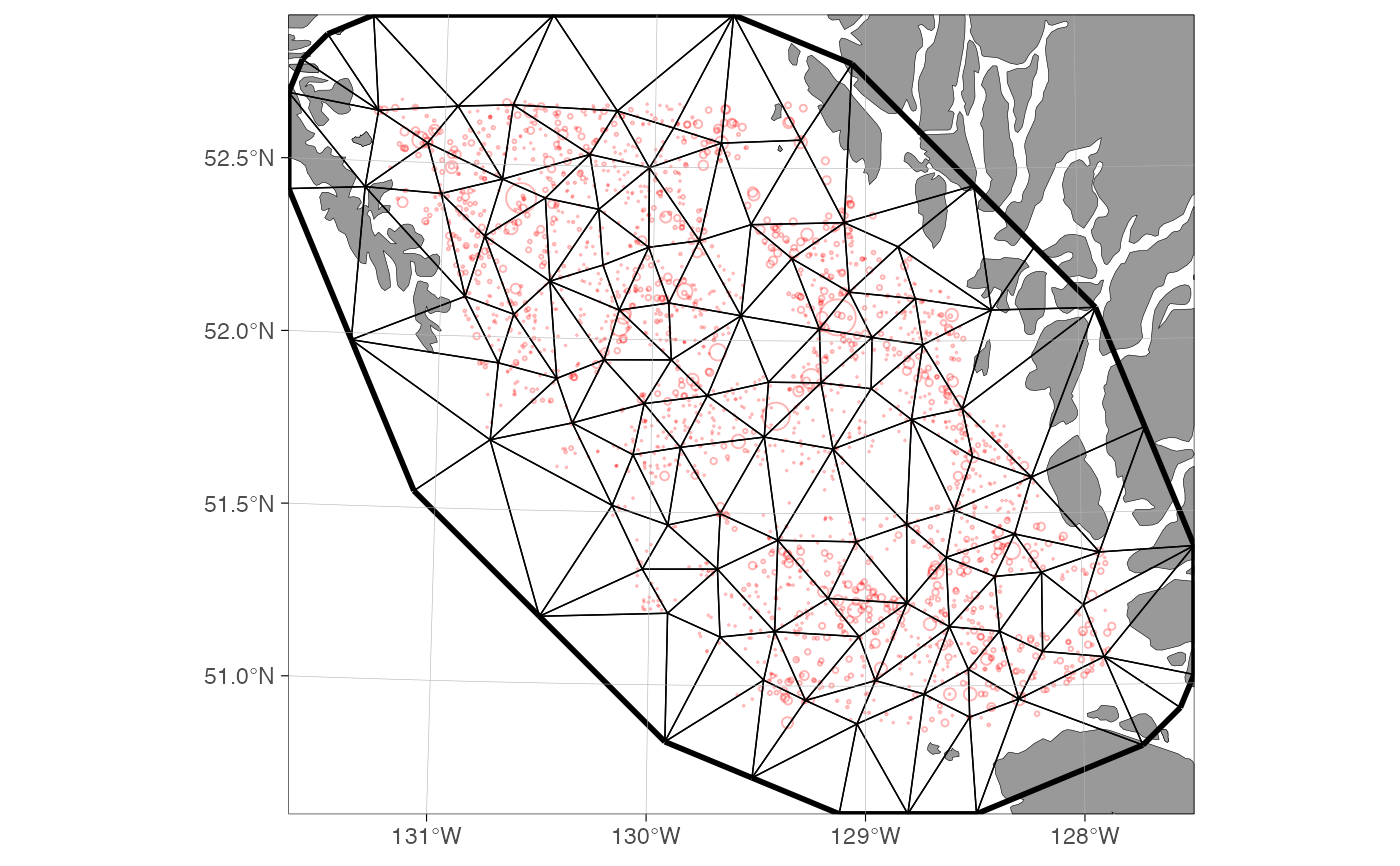
Draws a sdmTMB::make_mesh() mesh over a ggOceanMaps::basemap(), optionally
overlaying the sampling positions as red points. When a barrier mesh is
present (e.g. from sdmTMBextra::add_barrier_mesh()), the barrier ("land")
triangles are marked with an X.
Usage
plot_mesh(
  mesh,
  crs,
  data = NULL,
  value = NULL,
  xy_cols = c("X", "Y"),
  coord_multiplier = 1000,
  base_size = 11
)
Arguments
- mesh
An sdmTMB mesh object (from
sdmTMB::make_mesh(), optionally with a barrier mesh added).- crs
Coordinate reference system (projected, in metres) used for the basemap.
- data
Optional data frame of sampling positions with coordinate columns (see
xy_cols), plotted as red points.- value
Optional character naming a column in
dataused to scale the point sizes.- xy_cols
Character vector of the coordinate columns in
data. Defaultc("X", "Y").- coord_multiplier
Numeric factor to convert model coordinates to CRS units. Default
1000.- base_size
Numeric. Base font size. Default
11.