Skip to contents

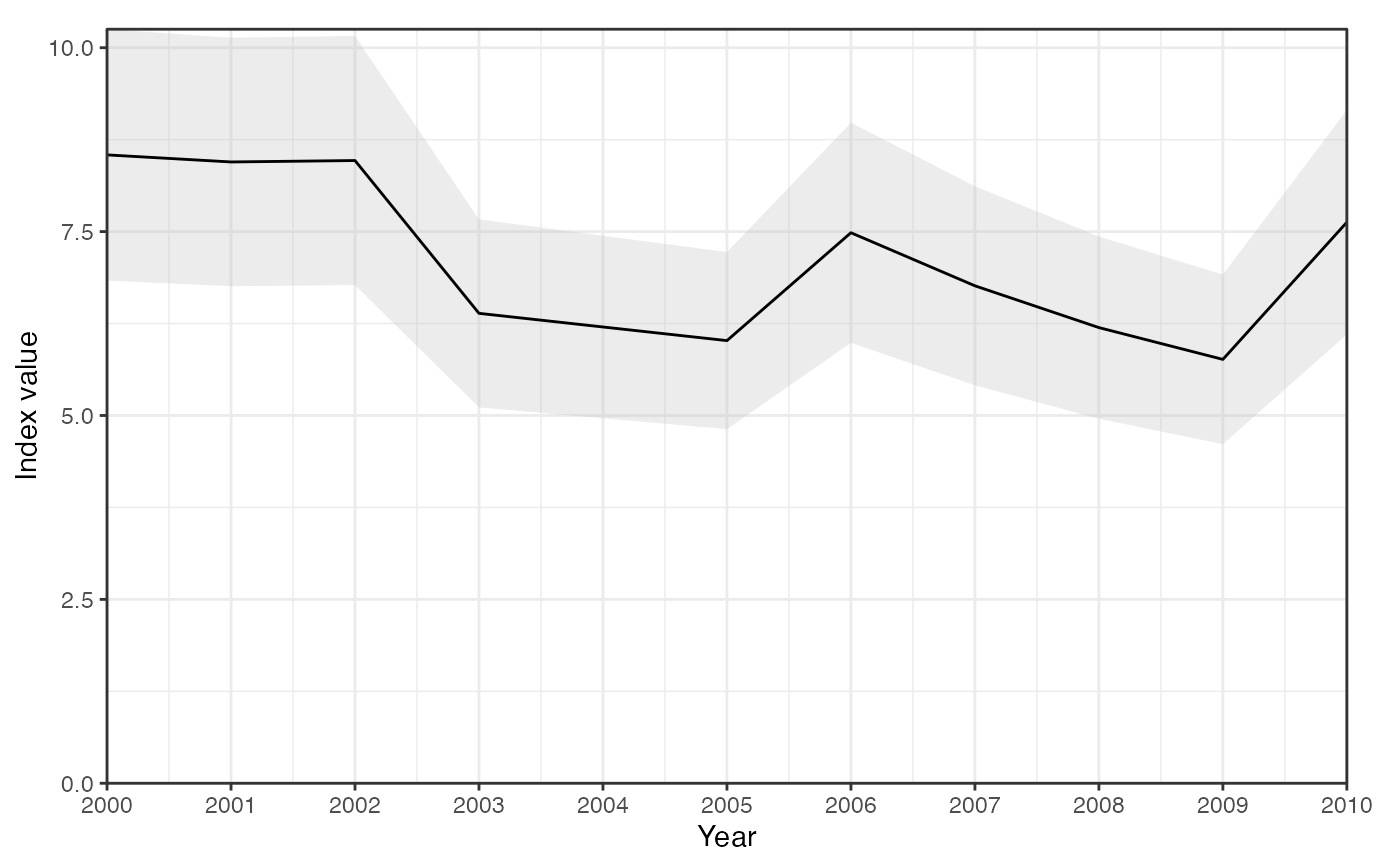
Plots one or more index time series (each from sdmTMB::get_index() / sdmTMB::get_index_split()) with confidence ribbons. A named list of indices is faceted or coloured by name.

Usage

plot_index(index, facet = TRUE, index_unit = NA, base_size = 11)

Arguments

index

A data frame with year, est, lwr, upr, or a named list of such data frames.

facet

Logical. If index is a list, facet by name (TRUE, default) rather than colour by name.

index_unit

Optional character for the y-axis label. Default NA.

base_size

Numeric. Base font size. Default 11.

Value

A ggplot object.

Author

Mikko Vihtakari

Examples

idx <- data.frame(year = 2000:2010, est = runif(11, 5, 9))
idx$lwr <- idx$est * 0.8
idx$upr <- idx$est * 1.2
plot_index(idx)