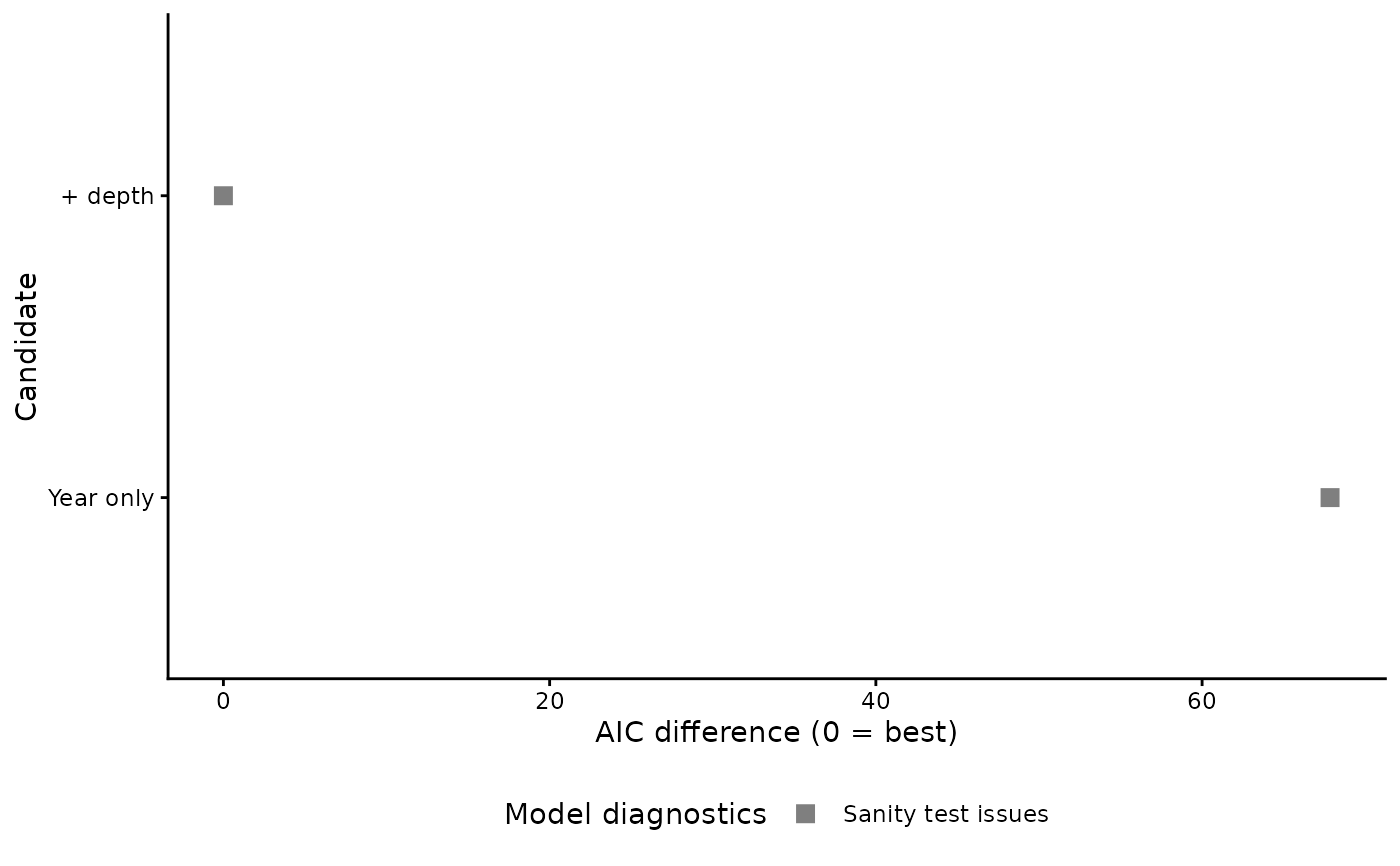
type = "selection" draws the ranking as a status-coded dot plot: one point
per candidate, positioned by how far it is from the best, coloured and shaped
by whether it crashed, failed to converge or failed sdmTMB::sanity().
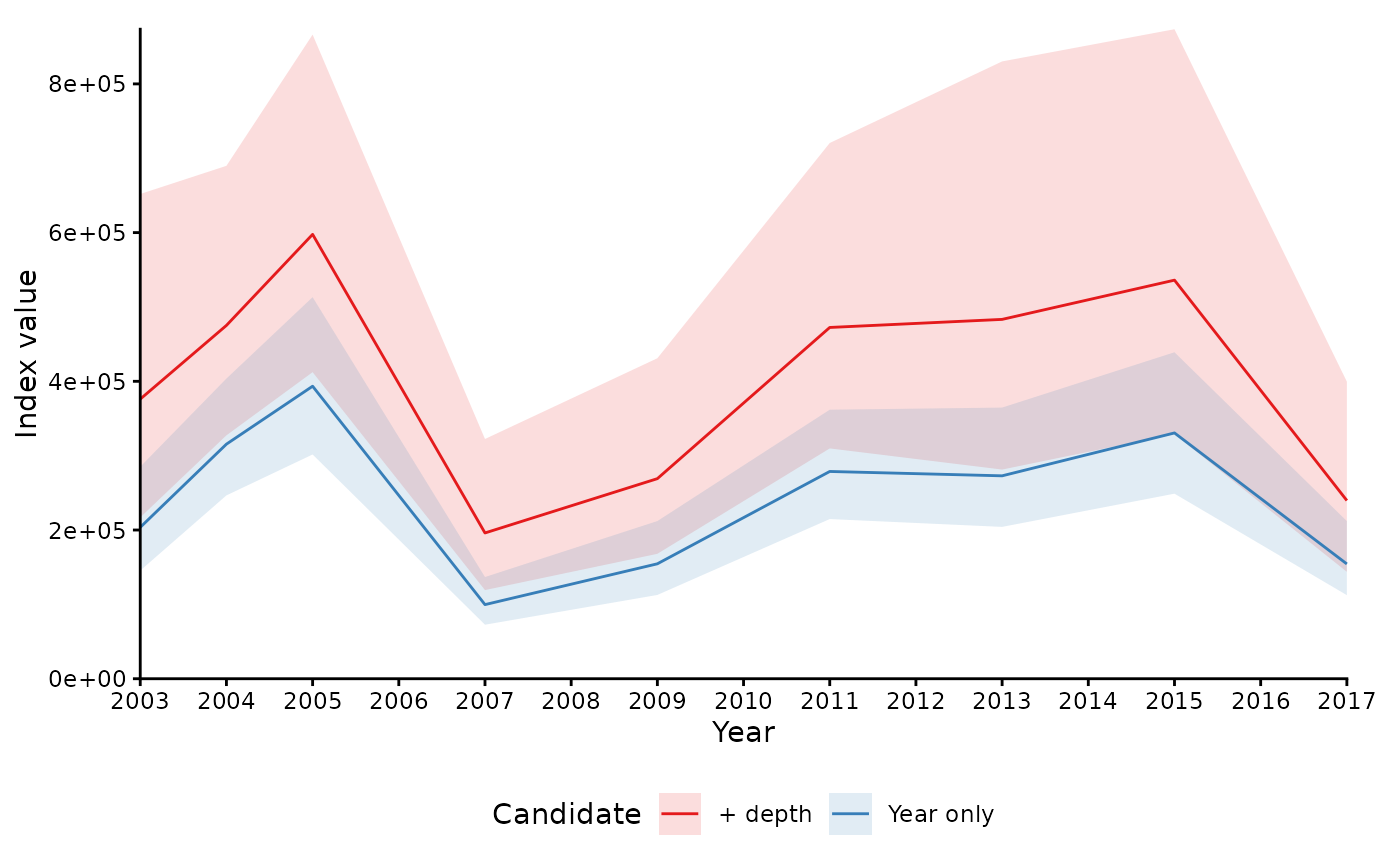
type = "index" computes and overlays the survey index each candidate
produces, which answers the question a selection table cannot: does this
choice actually move the index?
Usage
# S3 method for class 'sdmTMB_selection'
plot(
  x,
  type = "selection",
  metric = NULL,
  newdata = NULL,
  index_divisor = NULL,
  unit = NA,
  bias_correct = FALSE,
  level = 0.95,
  area = 1,
  nsplit = NULL,
  silent = TRUE,
  base_size = 11,
  ...
)
Arguments
- x
An object of class
sdmTMB_selection.- type
Character.
"selection"(default) or"index".- metric
Metric for
type = "selection":"cv_deltaNLL","deltaAIC"or"deltaNLL".NULL(default) picks the cross-validated metric when it is available anddeltaAICotherwise.- newdata
Prediction grid, required for
type = "index".- index_divisor
Optional numeric divisor applied to index values.
- unit
Character. Unit label for the index axis.
- bias_correct, level, area, nsplit, silent
Passed to
sdmTMB::get_index_split()fortype = "index".- base_size
Numeric. Base font size. Default
11.- ...
Currently ignored.
Examples
# \donttest{
cands <- list(
"Year only" = density ~ 0 + as.factor(year),
"+ depth" = density ~ 0 + as.factor(year) + depth_scaled
)
sel <- sdmTMB_selection(
cands, data = sdmTMB::pcod, cutoff = 25, family = sdmTMB::tweedie(),
time = "year", spatial = "on", spatiotemporal = "iid"
)
#> Candidate 'Year only': fitting.
#> Candidate '+ depth': fitting.
plot(sel)
 nd <- sdmTMB::replicate_df(sdmTMB::qcs_grid, "year", unique(sdmTMB::pcod$year))
plot(sel, type = "index", newdata = nd)
 # }